With capital efficiencies being such a hot ticket issue for hedge funders today, any opportunities to trade with a greater level of efficiency are surely welcome.
With capital efficiencies being such a hot ticket issue for hedge funders today, any opportunities to trade with a greater level of efficiency are surely welcome.
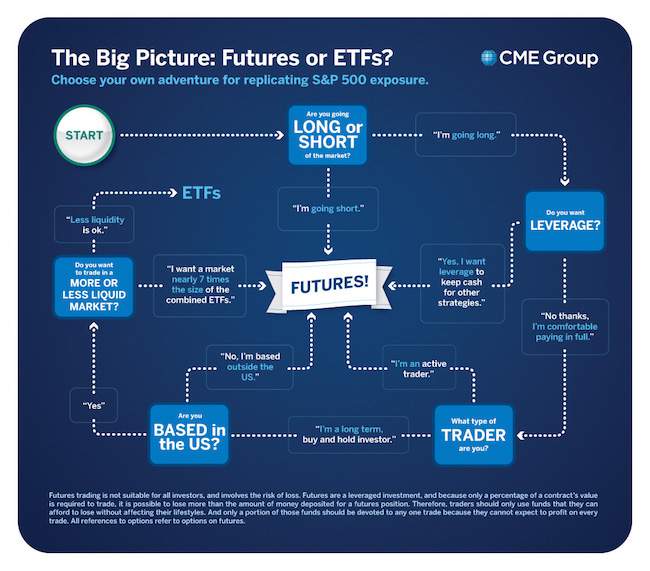
Which makes a new white paper written by CME Group all the more well timed. Entitled: “The Big Picture – A Cost Comparison of Futures and ETFs”, the paper deep dives into how the total costs of holding futures and ETFs differ over two time horizons: short term (three months or less) and long term (more than three months).
The purpose of the paper is to quantify the cost of replicating the total return of the S&P 500 index over a given time period.
Four investor scenarios are considered:
• Fully Funded
• Leveraged (2x and 8x)
• Short Seller
• Non-US
The products used in the analysis include the CME E-mini S&P futures and three prominent US-listed S&P 500 ETFs: SPDR SPY, iShares IVV and Vanguard VOO.
Overall, eight common investment scenarios are examined (four products, two time horizons) and the results are stark: in seven out of the eight scenarios futures are the cheaper option. The one scenario where traders benefit from using ETFs is as a long term fully funded investor – more details on this later.
This is not to suggest that there is a clear delineation for when to use futures and when not to. There is no unilateral answer, nor was this CME Group’s intention when writing the paper. Rather, as Tim McCourt (pictured), Head of Equities at CME Group explains, the primary reason for writing it was to provide “what we think is a more robust framework that investors can use to determine what is the best approach for them; when should they use futures? When does it make sense to use ETFs?
“One of the key findings of the paper was that for short investors, leveraged investors and non-US investors, futures are hands-down the better option for getting index exposure in the US. We acknowledge that for fully funded investors, over a long time horizon ETFs are the better option. But in making that statement, it’s important to stress that that’s only if you look at this from a cost perspective,” says McCourt.
One of the assumptions made in the paper is that there is no other element to an investor’s strategy whether it is liquidity, cash management, or taxes that may still make futures a more attractive choice.
“The report is only looking at this in terms of transaction cost, holding cost, commission and clearing,” adds McCourt.
Given the sheer diversity of investors, it would ignore the complexity of the issue to suggest that all those who are fully funded should suddenly switch to ETFs if the holding period is in excess of three months. There are plenty such investors who will continue to embrace futures as part of their strategy, because of the flexibility they provide, the depth of the liquidity they offer; for reference, the liquidity of the CME E-mini S&P future is nearly seven times that of the SPY and 150 times that of the IVV and VOO combined.
Still, the paper provides a valuable framework for traders to at least consider their options when gaining market exposure and deciding on the best choice of instrument.
“At CME Group, we view ourselves as an agnostic marketplace. Our motivation for writing the paper is that we wanted to provide an unbiased, balanced approach to show how to evaluate the eight most common investment scenarios. The aim of the paper is to help the marketplace by providing a framework with which to make investment decisions in the most efficient and informed manner,” comments McCourt.
Indeed, the framework is a way to understand, from a cost perspective, all the benefits of futures not necessarily just commission or what a dealer might say is the implied financing cost of the roll. This often tends to be wildly quoted and inaccurately represented because everyone is using different time ranges, different days of rolling.
The two main costs involved when replicating an index are transaction costs – the entry and exit costs to trading instruments – and holding costs.
Explaining Holding Costs
To cut to the chase, CME Group’s research makes the assumption that E-mini S&P 500 futures have an annual holding cost of 20 basis points above 3-month USD Libor, whereas the average holding cost for the three selected ETFs is 5 to 9.45 basis points.
The nature of the holding costs varies between futures and ETFs. For fully funded investors using ETFs, this is the management fee and as such is fixed; that is, I buy a USD100 ETF for USD100. For the leveraged investor, CME Group chose what it believed were the two most common scenarios: one is where the investor uses a regular securities account subject to Reg T margining, whereby the maximum amount that can be lent is 50 per cent, producing 2x leverage. The second scenario is 8x leverage, which involves the investor getting risk-based portfolio margining from a prime broker under Reg U.
“You’re going to pay different funding rates as a leveraged investor. The assumption we use in the paper is that the cost is 3-month Libor plus 40 basis points. This is a middle-of-the-road funding rate that your average hedge fund would get from their prime broker to purchase ETFs at will,” explains McCourt. To keep this research balanced, we used what we believe to be on-average cost assumptions for both ETFs and Futures.
With futures, the holding cost is not as explicit. With respect to margining, an investor need only post 5 per cent initial margin, which is substantially better (10 times) than investors subject to Reg T margining when buying ETFs.
The trade off, however, is that the investor is subject to implied financing or roll cost of the future, which varies over time. “On average, we’ve found that this tends to be 3-month USD Libor plus 20 basis points for the recent rolls,” says McCourt.
Futures contracts are rolled at the end of every three months. The cost to doing this is entirely subject to the supply and demand of the roll each quarter. This explains the variable holding cost. Over time, the cost to rolling varies. This is especially true of the last few years where the roll richness has ranged from 3-month USD Libor minus 40 basis points during the financial crisis, to 3-month USD Libor plus 40 basis points, as seen in 2013.
Roll “richness”
To briefly explain, the term “roll richness” is determined by comparing the interest rate the investor earns by holding unused cash on deposit (equivalent to 3-month Libor) to the implied interest paid for holding the future (the roll cost). If the future is rolling cheap it means that the implied funding is below Libor, whereas if it is rolling rich then the implied funding is above Libor.
Between September 2012 and December 2013, the futures roll with respect to the S&P 500 climbed from 3-month USD Libor minus 5 basis points to 3-month USD Libor plus 40 basis points. During this period, the S&P tracked upwards, and has over the last three years doubled in size. One of the more simplistic reasons offered to explain this increase in roll richness is that it is linked to regulation and the reluctance of banks to use their balance sheet but as McCourt comments:
“That’s not something that we at CME Group see supported by evidence. Even anecdotally when speaking to the banks we know that some of them are increasing their short position during the roll and being more optimistic at these elevated rates.
“What often gets overlooked with respect to roll pricing is that it’s governed by the laws of supply and demand. There are two pools in the marketplace: those that are short futures and those that are long futures for different fundamental reasons. Every three months those contracts need to roll and there will either be excess supply or excess demand.
“What is more driving the roll, in tandem with your point on the doubling of the S&P, is that because the market has been growing for the last few years it has led to the removal of other natural shorts from the roll. In bull markets, life insurance companies and others that have variable annuity need to hedge less, hedge funds also aren’t perpetually rolling short futures contracts as they’d be losing money. There has been an exit on the supply side of the roll, but it’s too much of a leap to suggest that it is just banks that have caused this.”
What is happening right now is a true supply/demand shift and an opportunity for traders to see how opportunistic they can be with respect to either capitalising on the richness (short futures) or waiting to see whether they will be will rewarded to roll (long futures).
The Fully Funded Investor
The fully funded investor is able to achieve a 12-month cost advantage of between 10.2 and 13.7 basis points when using ETFs over futures. This cost saving falls to between 0.2 and 3.7 basis points when using a 10 basis point renormalisation of the futures funding rate from 20 basis points to 10 basis points. Under such circumstances the breakeven point of when ETFs become more cost-efficient than futures is pushed out several months beyond the three-month breakeven point. The first ETF to cross the breakeven point is the VOO, after 208 days.
That futures become more costly than ETFs after three months when using a holding cost of 3-month USD Libor plus 20 basis points is understandable given that this is the point at which the investor must pay the roll cost.
“We weren’t too surprised by this result. What is interesting, which we didn’t include in the report, is that as the implied cost (roll richness) drops, the three-month breakeven moves out along the time curve to four months, five months etc. In the report we only considered the E-mini S&P 500 future and the three most popular S&P ETFs.
“What is also interesting is the embedded management fee of ETFs. For the three we selected they are single digit fees but if you look at other ETFs, such as State Street SPDR ETFs where the management fee is up to 18 basis points versus CME Group’s Select Sector index futures, then that same relationship doesn’t hold true. The breakeven point is much further out than three months because the18 basis points annualized is close to our 20 basis points assumption for futures,” explains McCourt.
What this shows is that the three-month crossover is not unilateral. It is a function of the cost of rolling versus the management fee of the ETF being used.
Over the long term, ETFs are more cost efficient for the fully funded investor but as the report shows, this is the only scenario.
“If you look at the leveraged investor the cost saving is somewhere between nine and 24 basis points over a one-year holding for using futures, for the short investor the cost saving is 53 basis points, and for non-US investors that figure rises further to a 60 basis point saving because of taxation. The message here is that where futures win, they do so by a large margin,” comments McCourt.
The Leveraged Investor
The findings of CME Group’s report show that the cost advantage of futures compared to ETFs over a 12-month period is 8.2 basis points and 23.1 basis points for the 2x leveraged and 8x leveraged investor respectively.
Compared to the fully funded scenario, the total cost increases for both positions. However, due to above-Libor rates charged on borrowed funds by a prime broker, the ETF holding cost is found to increase by 20 basis points per annum more than the futures.
This is not an insignificant amount if a leveraged hedge fund trader, for example, is weighing up whether to use futures or ETFs. A 20 basis point cost saving on a multi-billion dollar portfolio can lead to significant portfolio efficiencies, improve returns and as McCourt suggests: “Assuming there’s no other benefit to extract I think you’d be hard pressed to find a reason for paying an extra 20 basis points annualised to have someone manage your index exposure.”
There are other cost benefits to using futures aside from just holding costs. One of these is the tax saving implications that investors aren’t always aware of. All of CME Group’s equity index futures contracts are Section 1256 contracts and have a blended 60 per cent long term 40 per cent short term capital gains treatment in the US.
To be clear, the 20 basis point cost saving in the context of CME Group’s paper only relates to the cost of leverage.
“It’s not to suggest that 20 basis points is going to be the swing between being profitable and unprofitable but on the margins I think people are going to be interested in saving 20, 30, 50 basis points additional returns with very little change in risk profile because they’ve moved from ETFs to futures,” opines McCourt, who concludes: “It’s up to investors to do their own analysis. We’re just trying to provide the framework. Our primary concern is to create the fairest marketplace for people to trade in.”
To read The Big Picture report in full, please click here