PARTNER CONTENT
By Bob Stock, PhD Principal Equity and Analytics Researcher, Axioma by SimCorp
We often speak with both fundamental managers that might not have the luxury of a team of analysts to comb through financial reports and earnings calls, and quant managers that lack access to expensive data sets. For these types of challenges, we present a concept that could help hedge fund firms create long-short portfolios that piggyback on the best publicly-available ideas of informed traders.
By combining academic research on factor portfolio construction with Axioma risk models, managers can produce an out-of-the-box “alpha capture” strategy: the ‘Budget Hedge Fund Index’.
Portfolio construction
We start with the most recent version (v.5.1) of the Axioma US Equity Factor Risk Model which includes factors in a ‘Sentiment’ theme based on the market activity of traders (Crowding, Short Interest, and Opinion Divergence).
For a realistic, investible portfolio, we use the Axioma “estimation universe” of the most liquid and representative equities, which for the US market is roughly 3,000 stocks. Next, since academics often look at “decile-spread” portfolios (long the top-10% of stocks and short the bottom-10% based on some factor ranking), this portfolio will nominally hold 600 equities.
In the 2023 paper Power Sorting by Kagkadis, Lohre, Nolte, Nolte, and Vasilas, the authors found that
...the factor portfolio Sharpe ratio is maximized by adopting an aggressive stance on the short side and a more conservative stance on the long side.
So, instead of equally weighting the top-300 Crowding stocks for the longs and the top-300 Short Interest stocks for the shorts, we will be more diversified with 500 longs and more concentrated with 100 shorts.
The portfolio is rebalanced every month-end, with 0.2% of our capital in each of the 500 stocks with the highest Crowding exposures, and a 1% short exposure in each of the 100 stocks with the highest Short Interest exposures. Ideally, this will create a market-neutral portfolio that is 100% long, 100% short, 200% gross, and 0% net.
A few stocks, however, end up in both lists. When this occurs, we become agnostic and zero out the exposure on both sides, holding “cash” (with a return of zero) instead of re-allocating. Also, we require a minimum market cap of $40 million for the longs, and a minimum market cap of $100 million with at least $100,000 of average daily volume for the shorts. Any candidate failing these screens is likewise dropped for cash.
Finally, since stocks with high Opinion Divergence scores are prone to react positively to news (because uncertainty depresses prices), we replace with cash any equity in the short portfolio with an Opinion Divergence score higher than 1.
Assessing the performance
For a 10-year backtest from December 31, 2013, through December 31, 2023, the portfolio is actually, on average, 96% long, 71% short, 167% gross, and 24% net long, with 551 positions. This slight net-long position is also more typical of a real long-short equity hedge fund.
The performance does not include transaction costs. Two-way average monthly turnover averages about 16%, which at an assumed cost of 5 bps would be only about 10 basis points of drag per year. While the cost of shorting is also not included, neither is the gain from margin interest or cash. And since the portfolio uses the most highly-shorted stocks by construction, they evidently must be easy to short.
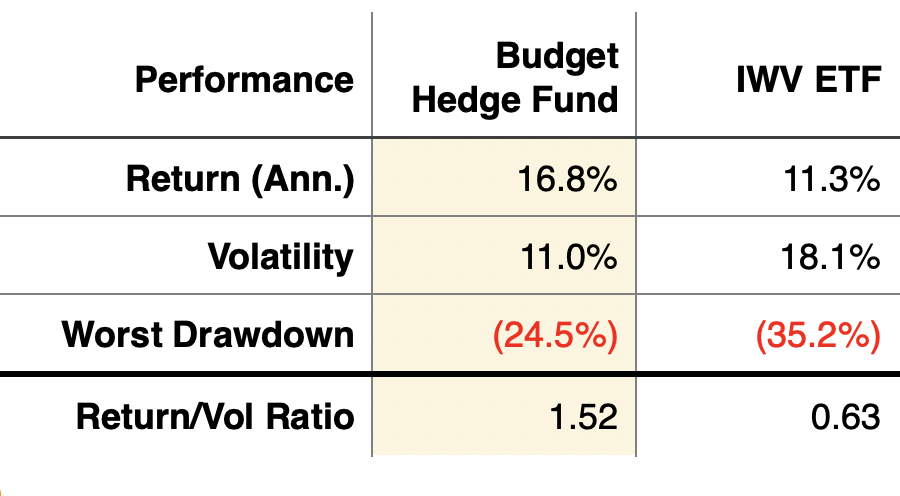
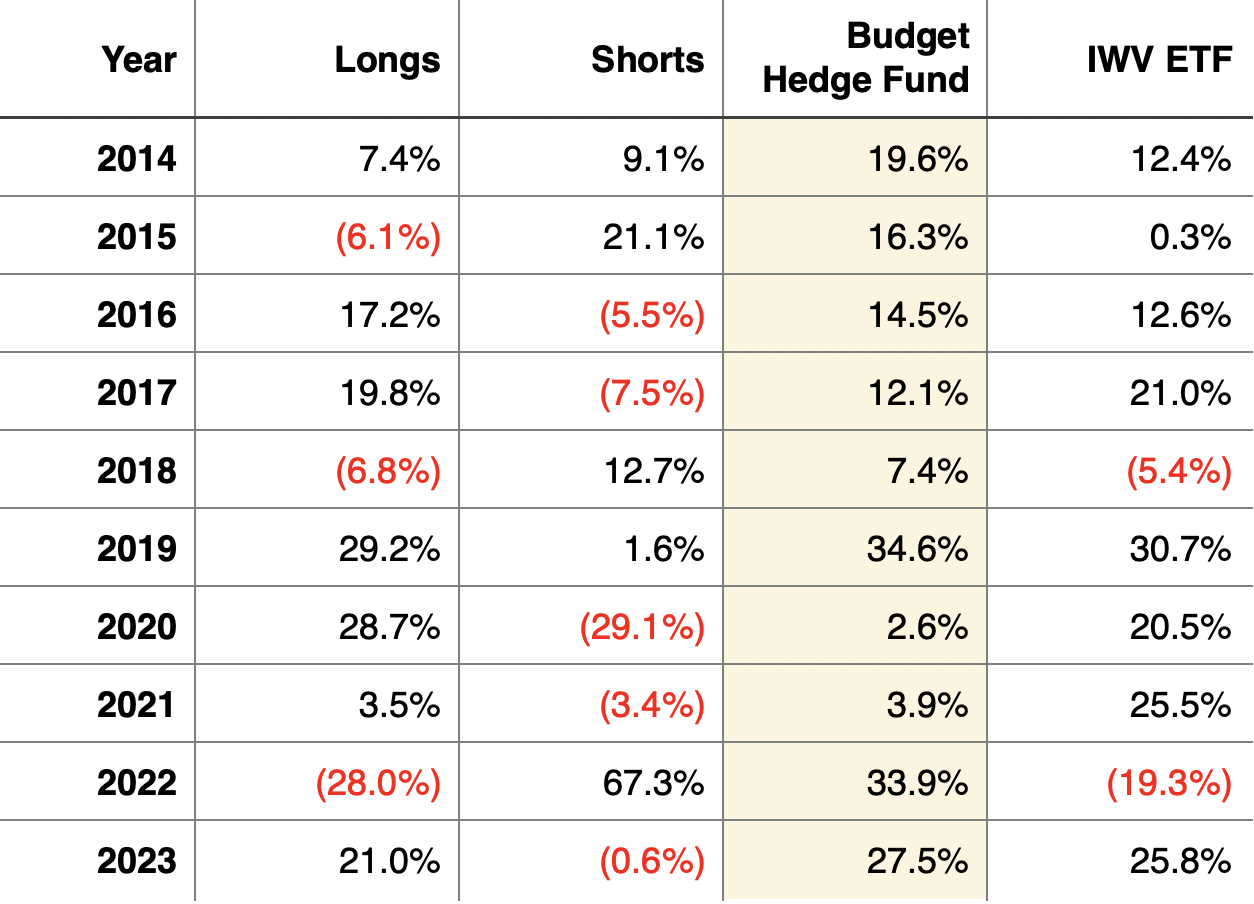
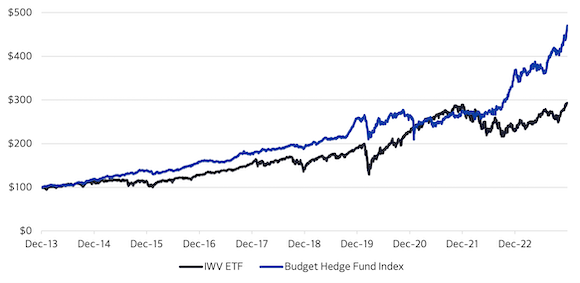
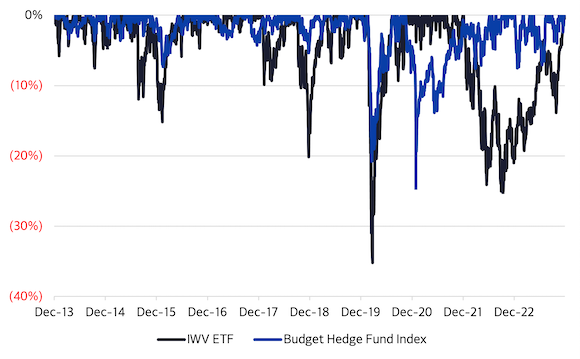
We compare the Budget Hedge Fund index with IWV, an Exchange Traded Fund which seeks to mimic the returns of the Russell 3000 index. Summary statistics are in Figures 1 and 2, the hypothetical growth of $100 is shown in Figure 3, and drawdowns are in Figure 4. The benchmark is handily crushed on all measures.
Figure 1: Summary performance statistics
 Source: Axioma US Equity Factor Risk Model (US5.1), Russell 3000 ETF
Figure 2: Hypothetical annual returns
Source: Axioma US Equity Factor Risk Model (US5.1), Russell 3000 ETF
Figure 2: Hypothetical annual returns
 Source: Axioma US Equity Factor Risk Model (US5.1), Russell 3000 ETF
Figure 3: Hypothetical growth of $100
Source: Axioma US Equity Factor Risk Model (US5.1), Russell 3000 ETF
Figure 3: Hypothetical growth of $100
 Source: Axioma US Equity Factor Risk Model (US5.1), Russell 3000 ETF
Figure 4: Drawdowns from last peak
Source: Axioma US Equity Factor Risk Model (US5.1), Russell 3000 ETF
Figure 4: Drawdowns from last peak
 Source: Axioma US Equity Factor Risk Model (US5.1), Russell 3000 ETF
Investigating the returns and drawdowns, we see the only time things “went wrong” was in the rapid recovery of the market in late 2020 and early 2021, when the shorted stocks rebounded much more strongly than the longs, causing a sudden drop in the portfolio. The Opinion Divergence screen mitigated that drawdown by 8%, however, and even though it made the portfolio 9% more net long than it otherwise would have been, it actually reduced the volatility by nearly 1% and slightly increased returns. Other drawdown periods were significantly muted versus IWV, especially in 2018 and 2022.
A compelling investment opportunity
Using an off-the-shelf factor risk model, you can come up with some of the best ideas for longs and shorts regardless of the size of your fund. By using a few simple, reasonable assumptions, you can develop a hedge fund strategy worthy of further study right out of the box. Learn more about the Axioma Equity Factor Risk Models, the Axioma Portfolio Optimizer or request a demo here.

Robert (Bob) D Stock, PhD, Principal Equity and Analytics Researcher, SimCorp – Bob develops Axioma factor risk models for SimCorp. After earning his undergraduate degree in Physics from Princeton and his doctorate in Physics from Carnegie Mellon, Bob worked for nearly a decade at MIT’s Lincoln Laboratory in the Directed Energy Group, performing simulations and analysis of high energy laser beam propagation through the atmosphere for missile defense applications. Bob then served the Ultra-High Net Worth segment for 15 years, first as a Quantitative Researcher for a boutique outsourced-CIO where he developed the majority of the firm’s intellectual property for hedge fund analysis, risk management, forecasting, and asset allocation. Subsequently, he served as a systematic portfolio manager for a large Trust before joining Axioma (now part of SimCorp) in 2022.
Building the quantitative infrastructure for the next generation of institutional markets
PARTNER CONTENTKatia Babbar, CEO of Immersive Finance, discusses the changing demands of institutional derivatives markets and why…
More
Making the case for hedge funds as next-generation diversifiers
PARTNER CONTENTAs part of Wellington's broader InvestorExchange podcast, this special mini-series takes listeners inside our hedge fund…
More
Making the case for hedge funds as next-generation diversifiers
PARTNER CONTENTAs part of Wellington’s broader InvestorExchange podcast, this special mini-series takes listeners inside our hedge fund…
More
